Beyond the text output
So far I have used the $monitor command in vvp to output a text log of the various state changes to a text file. vvp can also produce a more complete dump file with full details about all the changes in the signals. This can, supposedly, be viewed with gtkwave. Let's see if that will work.First we have to add lines like the following to our test bench file.
initial
 begin
  $dumpfile("test.vcd");
  $dumpvars(0,test);
 end
where you can use any name that you like for the dump file instead of "test.vcd". Let's try this with our 74194 test. It results in a .vcd file but then trying to run gtkwave I learn that I need to have a working version of X11 running.
So I am sent off to
where I download a .dmg which gives me an installer. I ran the installer without trouble, though required a logout and log back in before it would make itself the default X11.
Once logged back in I started X11 and waited till a terminal opened. I navigated to my Verilog directory and ran
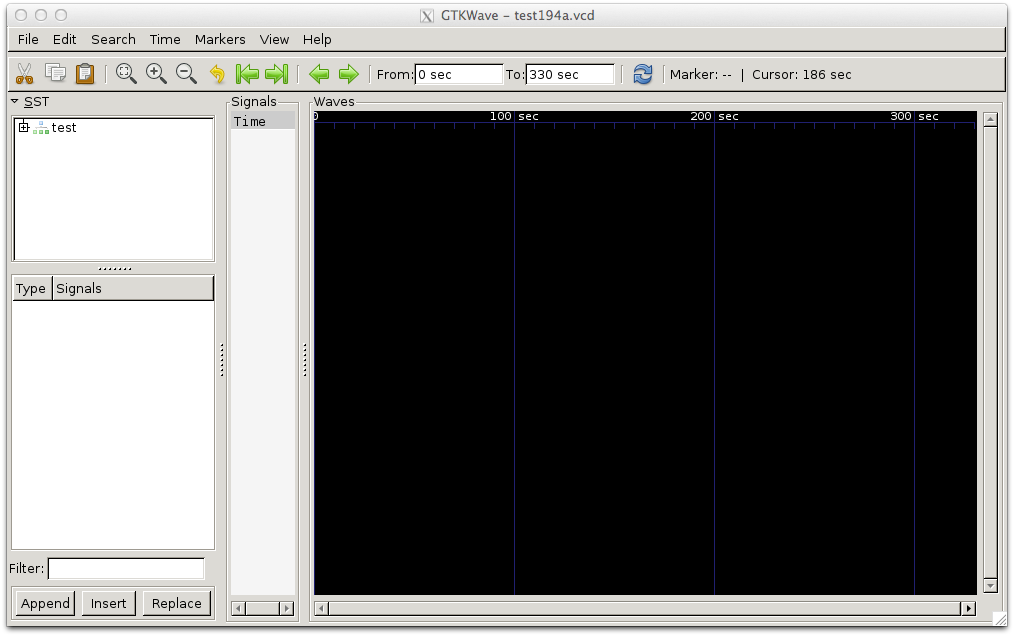
gtkwave test194.vcd &
which started up gtkwave shwoing a whole lot of not very much.
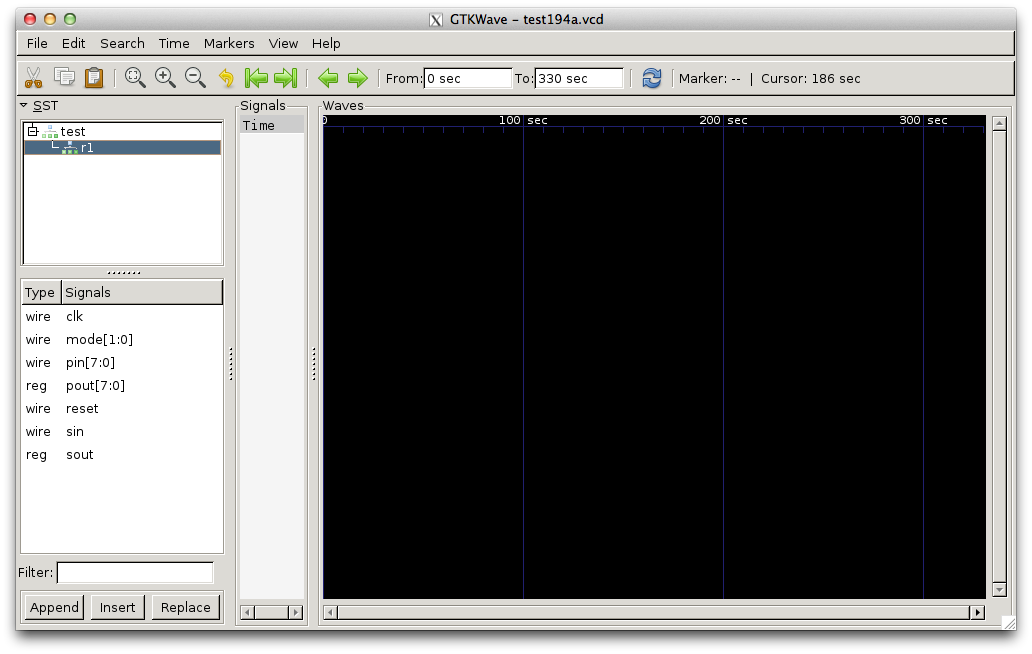
Clicking to expand the test item in the SST pane gives me a list of signals in the lower left hand pane.
Then selecting a bunch of signals and pressing the Insert button loads the data for those signals into the large time display on the right.
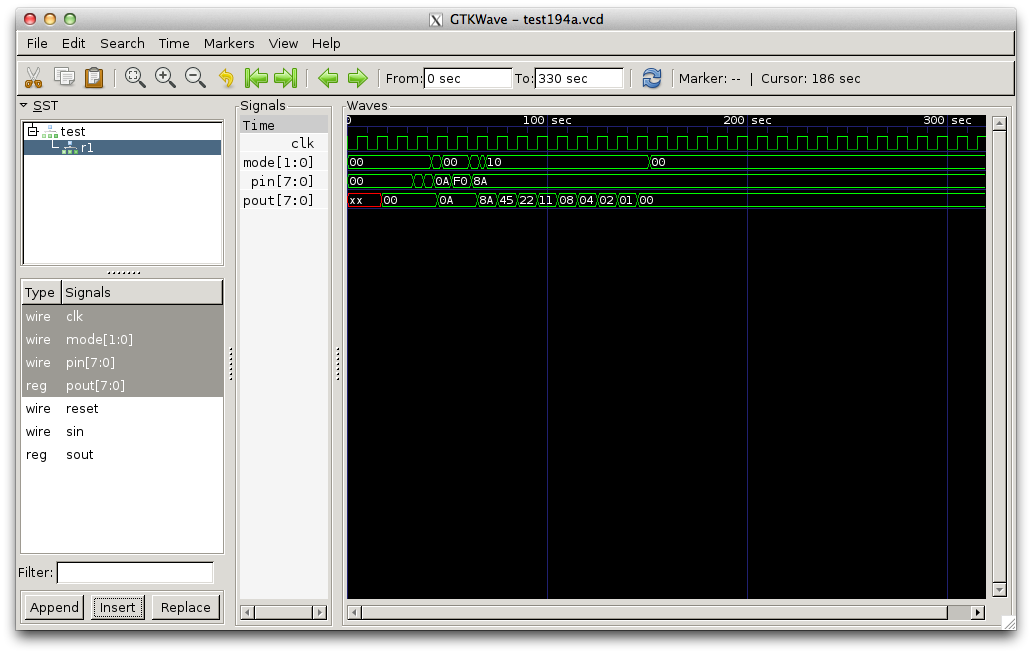
This gives a much more compact and visual display of the data than the text view and I will make heavy use of it from now on.